Saturday, October 12, 2013

A CUP & HANDLE PATTERN ON NIFTY

NIFTY WEEKLY CHART
Nifty Spot  Weekly Chart
Starting from the Low of 2008  a close look gives a kind of feeling that it is forming a Cup & Handle pattern, it is still in a formative stage and hence only my assumption, which may be proven wrong.  

This is another chart Nifty Spot which shows a better rounded formation (because of sudden plunge) and handle also seems to have been done.   One can have his own independent views.  As a trader we know when to and how to enter a trade.

Here is a small write up from  Investopedia on C&H pattern.

This is a bullish continuation pattern where the upward trend has paused, and traded down, but will continue in an upward direction upon the completion of the pattern. This pattern can range from several months to a year, but its general form remains the same.   The construct of the cup itself is also important: it should be a nicely rounded formation, similar to a semi-circle. The reason is that a cup-and-handle pattern is a signal of consolidation within a trend.

Keep an Eye !
SHEKHAR

Monday, September 30, 2013

RELIANCE INDUSTRIES

Reliance Industires 
Reliance Industries Weekly Chart Sept. 27, 2013
Symetrical Triangle.  Keep an  Eye on the Beakout it may give nice move upto 1647.
Please note Chart is weekly and It may take months to give a BO and my take is Once Nifty bottoms out Reliance will lead the Charge in new  Rally
Happy Trading !
SHEKHAR

Wednesday, August 28, 2013

Nifty Alternate Bullish Count

NIFTY LEADING DIAGONAL
This a possible alternate count which starts from lows of 4538   wave 1 being a Leading diagonal now W2 running c = 1.62 * a = 5011.

Although corrections in wave 2 after Leading diagonals are deep and  can retrace upto 80%  4875 approx. 5172 is 61.8% retrace it may also hold by the close of the day one needs to keep an eye on it.


Happy Trading !
SHEKHAR


Friday, August 23, 2013

USDINR: Has Rupee Bottomed Out ?

USDINR WEEKLY CHART
Startng from lows of Aug 2007 at 39.06 wave 3 is nearing completion, if it happens to be a normal wave i.e. 161.8% of w1.  

The wave 3 in the weekly chart can be still shown as incomplete (if we go by the form i.e. looking for 5 waves within wave 3 with 3(iv)  and 3(v) yet to be done)  it would be suggestive of greater weakness in the rupee.  For the present I am  assuming that  W3 is likely to close nearer to 161.8 of W1  on weekly chart, and discarding the form.   We can see a slow and grinding larger wave 4 recovering upto Rs 57.

The internal strucutre as seen in hourly chart shows that there is still a small upmove pending and which is likely close around 67.  Expect a mild recovery closer to 63.08 - 62.33 ranges and a final push to 66-67 before a decent recovery in Rupee begins. 
USDINR  HOURLY CHART


Tuesday, August 6, 2013

Friday, July 12, 2013

Nifty Update


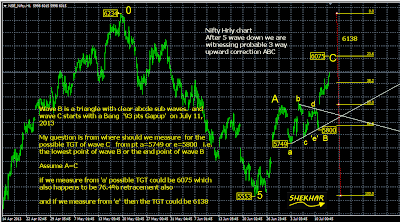
As of now it seems  Tgt for Nifty could be 6079. Chart is self explanotary.
NIFTY

Friday, June 21, 2013

NIFTY DOWN TREND STARTED

NIFTY WEEKLY CHART
It appears that Nifty has completed c of wave B at 6233 and down trend has started  we get a confirmation below 5476.

This down trend starting from 6233 will be  in 5 waves.


This first set of 5 wave (forming wave 1 of C) is likely to end at 5529 as per golden ratio,  if we go down further into the internals of wave 5 it suggests  end point closer to 5555.  So for now I anticipate fall to stop in the range of 5555-5529

NIFTY EOD CHART
There is an outside chance of taking out the previous low of 5476 as wave three was little less than normal- wave 5 could extend,  to confirm the downtrend.

For now wait for a 3 wave up-move to initiate fresh shorts for big gains.  If one can manage to trade, upmove  of 300-400 pts is on cards.

Tentative Road Map for wave C  6233 > 5529 > 5961 > 4820 > 5250 > 4382 necessary correction will be  made as we move along and waves unfold themselves.

Happy Trading !
SHEKHAR


Saturday, May 4, 2013

NIFTY WAY FORWARD

NIFTY MEDIUM TERM  VIEW

I had posted a count on Nifty in July 12 and next in Dec 12, I feel that bearish count is still valid and nothing has changed since.

The downmove which started from 6115 in the end of Jan 2013 and reached the low of 5476 has
negated any bullish count starting from the lows 4534 in oct 2011, we can't label it as impulsive wave, simply because of the overlap, unless of course the 3rd wave itself is subdividing and we are witnessing the 3rd of 3rd which implies super bullish trend.


For now, I am still taking this upmove as 'abc' of wave B starting from the Low of 4534, hence 138.2% of wave 'a' comes to 6278 and golden ratio target for internal wave 5 of wave 'c' comes to 6312 , which also happens to be a channel TGT.   

6278-6312 zone should be the end point of this upmove the whole correction ABC for the move starting from the low of Oct 2008 may turnout to be a Flat Correction, ending somewhere close to previous low of 4534.

SHEKHAR
Happy Trading!

Sunday, March 3, 2013

HCLTECH UPMOVE DONE !

HCLTECH EOD CHART 

A five wave move seems to have ended.

The five waves are in the following ratio

W2 retraced about 80% of the W1 followed by W3 which went tad higher than 1.618% of W1 and W4 retraced 38.2% of W3. Wave 5 is an extended wave and the possible targets are 718 > >757 >>781.

Now take a look at internal wave structure of W5

W (ii) retraced 61.8% of the previous move and followed by the massive W(iii) which extended close to 400% the next wave W(iv) retraced merely 23% of W(iii). All these move gives us possible end point of W (v) as 731 at 261.8% of W(i) or at 736.5 if taken as per golden ratio.

Woila ! Present move seems to have met resistance at 736.6 for now.

W 5 is an extended wave hence we should get a fast retracement, taking the price close to 500 !  

Happy Trading !
SHEKHAR

Thursday, January 17, 2013

BHARTI AIRTEL

Bharti Airtel  EOD Chart
For Positional Longs wait for correction.
This is an EOD chart for Bharti ARTL,  which clearly shows a five wave move past the reflex point is about to end.  The  estimated end point for wave 5 comes to 360.85,  and we can now look for 3 wave correction before we initiate positional Longs.  Supposing it ends at given tgt  we can expect 50% to 61.8% retracement i.e. look to buy in the range of 300 - 285.


Here is a short Trade for short term
Bharti Airtel  Hourly Chart
Here is a Hrly chart depicting the internal wave structure of the wave 5
w ii  is almost 78% of w i
w iii is 161.8% of w i
w iv is 38.2% of w 3
A normal  wave should have ended at 345 approx.  Here w v has started expanding and the possible TGT could be 359.5  at 100%   from there we can expect fast retracement  into the range of 329 -326.

If we go deeper into the sub wave and take the emerging ratios likely projected end is close to 361.  Hence from the above three we can safely assume that there is a very good chance for  a low risk short entry close to 360  with minimum stoploss  and tgt could be 329-326  and then may be  300-285

Keep in mind wave 5's can keep expanding,  we only know after the end of it.

Happy Trading !
SHEKHAR