 |
| YESBANK WEEKLY CHART |
Tuesday, September 30, 2014
Saturday, September 27, 2014
RCOM: An Elliot Wave Analysis
 |
| RCOM DAILY CHART |
17/09/2013
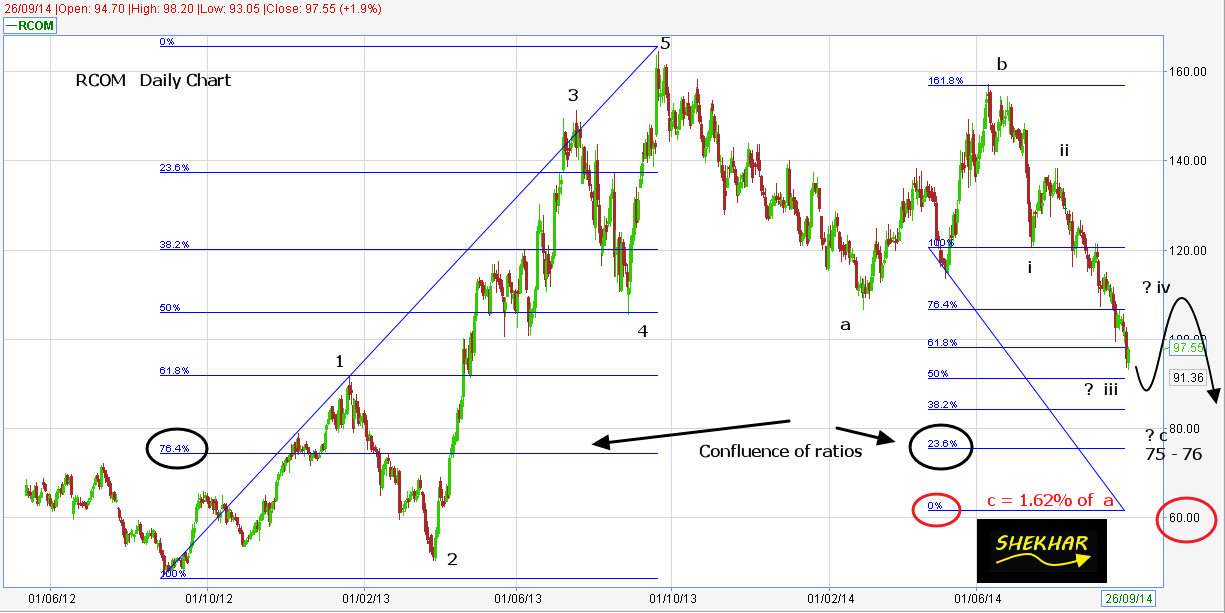
onwards RCOM is in correction mode wave a made a low of 106.75
followed by wave b up move which ended at 157.25 about 80% retrace of
wave a.
Wave c down has
started from 157.25 which is still continuing. A 61.8% retrace of
the previous impulse comes at approx 91 and for now wave c has made
a low of 93.05 on 26/09/2014.
Has wave c ended thus the correction completed ? The next impulsive wave is about to begin ???
Let us look
closely into the wave c. Wave c always consist of 5 subwaves, here
we can visualise that presently RCOM is in c (iii) (still on). c (iv) and c (v) are still to unfold.
Keeping all the
above in mind we can for sure say that there is still some more
downside left in the RCOM.
Where can this
downfall end ? Some reasonable estimate/guess can be at 74-77
range which happens to be 76.4% retrace of the impulsive move and
also 138.2% extension of corrective wave a. Confluence of Fibo
ratios is one important region to lookout for.
If it goes deeper
than the next lower level could be 64 approx. which happens to be
161.8% of the wave a what is quite normal for wave c to travel.
Once we are able
to define the end point of wave c (iii) we will have a better
estimation where the wave c could end. So keep a watch on the
internals of wave c and catch the next BIG MOVE UP !!!
Happy trading !
SHEKHAR
NB: All Fibo
values are approximation on visual basis they are not calculated
values.
Subscribe to:
Posts (Atom)