Setup 1
This one is from Saikat.
The set up for Long trade:
Price is making a double bottom or even slightly lower low.
RSI is rising.
1st Entry - near the 2nd low seeing the RSI +ve div
2nd Entry - when price Trendline is broken
SL - 5-8 points below that double bottom lows
So the first entry is only having SL of 5-8 points and 2nd one maximum around 15 points.
Profit Booking - Target is always a new days high or when we get closer to that.
For Short trade set up - just reverse......
The following points are also my observation and I suggest the trade should be ignored if otherwise
1) the double bottom/top should occur within max 1 hr.
2) the peak/trough in between shouldn't be a day's high/low.
3) In between the double bottom/top - there shouldn't be RSI crossover of 50
The above setup assume's the following.
1) Nifty is monitored on Yahoo charts with default values.
2) Trades are intraday.
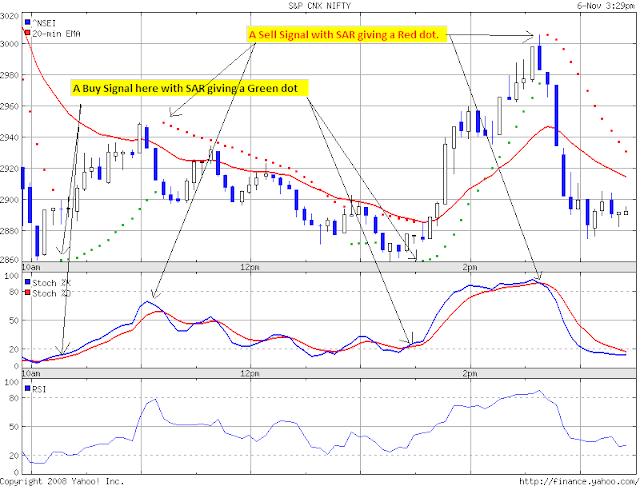
Setup 2
 Stochastic settings 39,0,0
 If Charts not let u make 0,0 then one can take it as 1 but use 39 (%K) only for interpretation.
Go Long when Slow Stochastic (39) comes from bottom to upside and cross 50 level.
Similarly shorts can be initiated when Slow Stochastic (39) comes from upside to downwards and cross 50 level.
One can keep the position open when the STS moves in overbought/ oversold zone also. The position should be covered only when the it comes out of OB/OS region or reverse crossover of 50 level happens. (eg. in case of long trade when STS again comes from upside to downside and crosses 50, then only the long position should be closed.)
Use 34 EMA for trend identification.
In the attached Nifty chart one can interpret that in bear market Sell signals were very profitable and now in bull market buy signals are the more profitable one's...so as per the market cycle one can chose to go long or short with this model.
Setup 3
Trading the Breakouts
1. Favorite patterns are ascending triangle, pennant and symmetrical triangle because of their dependable break out and speedy target appreciation.
2. Use the PRICE/VOL EXPANSION to shortlist the stocks to start with, see charts to look for possible BO candidates. This is step 1.
3. You will see lots of scrips here go through them one by one.
4. Open the charts (eod) and draw treandlines to SATISFY yourself that there is a valid reason for break out.
5.There will be 30-50 scrips listed here, among them you need to get around 5 stocks, because one will trade in one or two stocks per day, so per day 5 stocks is more than enough.
6.This is the most imp step. During this step, one need to make sure that the pattern which has shown price and vol expansion is a perfect ascending triangle, or symmetrical triangle or pennant whatever the category may be, but the pattern should be classic and robust
7.The target projection, just measure the perpendicular distance of the highest high from the lower TL and project it from the break out point,
8. Now the final step, DRAW PARALLEL LINES ON THE EVERY PREVIOUS HIGH TO MAKE SURE THAT NONE OF THESE STRONGEST RESISTANCE IS GOING TO BE AN OBSTACLE DURING THE TRADE, IF THERE IS ANY TL WHICH IS RELATIVELY CLOSER TO ENTRY THEN SIMPLY AVOID THE SCRIP.
9.Almost done, shut down your pc or start watching cartoons but few TRICKS are left yet.
10. Dont jump in the market with the morning bell. Wait atleast 5-10 minutes before taking 1st trade, after this time you will find that one of those five shortlisted has made an open/low, (it may seem ridiculous but one can generally get atleast 1 stock which has open-low) GO LONG!!!
If real time charts are available buy it around the support and then take sl a few rupees below the low or the support level near which you bought.
Setup 4
Here is a simple method based on 5 day EMA on highs and lows. Signals are generated at EOD and executed on the next day. The position is closed once the next (reverse) signal comes. One may close the long position and open shorts.
Setup 5
Intraday Trades
More to come, keep viewing.
Happy Trading !


