Showing posts with label SHORT TERM CALLS. Show all posts

Friday, October 31, 2014

CROMPTON GREAVES: TIME TO BUY FOR SHORT TERM

CROPMTON GREAVES DAILY CHART is enclosed with Elliot wave marking.  It is easy to deduce the following.


1. W2 is simple and corrected more than 50%
2. W3 is bit larger than 162% of W1
3. W4 is a complex correction with W 4(c) ending
at 38.2% of W3(subwave a equals subwave c)
4. 1st TGT for W5 will be 232. SL 175.75

Also note that on weekly charts price has made a hammer today. One can long above it with SL below the hammer i.e. 175.75

Happy Trading !
SHEKHAR
Crompton Greaves Daily Chart

Tuesday, October 7, 2014

BHEL: A BIT OF CONFUSION

BHEL MONTHLY CHART

BHEL DAILY CHART
 OR
BHEL DAILY CHART

This chart now seems to add clarity 
BHEL on Oct 09, 2014
BHEL 180 min CHART


Thursday, January 17, 2013

BHARTI AIRTEL

Bharti Airtel  EOD Chart
For Positional Longs wait for correction.
This is an EOD chart for Bharti ARTL,  which clearly shows a five wave move past the reflex point is about to end.  The  estimated end point for wave 5 comes to 360.85,  and we can now look for 3 wave correction before we initiate positional Longs.  Supposing it ends at given tgt  we can expect 50% to 61.8% retracement i.e. look to buy in the range of 300 - 285.


Here is a short Trade for short term
Bharti Airtel  Hourly Chart
Here is a Hrly chart depicting the internal wave structure of the wave 5
w ii  is almost 78% of w i
w iii is 161.8% of w i
w iv is 38.2% of w 3
A normal  wave should have ended at 345 approx.  Here w v has started expanding and the possible TGT could be 359.5  at 100%   from there we can expect fast retracement  into the range of 329 -326.

If we go deeper into the sub wave and take the emerging ratios likely projected end is close to 361.  Hence from the above three we can safely assume that there is a very good chance for  a low risk short entry close to 360  with minimum stoploss  and tgt could be 329-326  and then may be  300-285

Keep in mind wave 5's can keep expanding,  we only know after the end of it.

Happy Trading !
SHEKHAR


Sunday, July 15, 2012

Nifty Bearish View


This is an alternative view for the count which believes that correction to the wave starting from the lows of 2009 to the highs of 2010 has ended at 4534 and we are firmly in the uptrend and next impulsive started from 4534. 

So here is the bearish view. 

Chart 1 is a weekly chart. 

NIFTY WEEKLY CHART
Correction so far from the high of 6341 to 4534  is about 40%  of the previous uptrend which started from 2227.  Remember this is W2 and most of the times it does a retrace closer to 62%.  It almost comes to 3800.   Hence correction is still pending.

Nifty has so far completed  'a'  move and is presently in wave  'b' going up (Starting from the lows of 4534 wave structure so far is 5-3-? (most likely zig zag 5-3-5, Hence b up is on)  once the wave 'c' starts we may see the lower targets


Chart 2 daily chart. 


NIFTY DAILY CHART
Presently b:A 5 wave structure and b:B 3 wave done and b:C is going on, which has to be necessarily a 5 wave structure. Which on equality basis comes to 5812 approx. before any significant down move could unfold.  


Happy Trading ! 

SHEKHAR 


NB: Charts are for NF from GCI, hence values may be at a little variance for true NF values at NSE.


Sunday, May 20, 2012

RELIANCE COMMUNICATIONS


After going through the Pankaj's super bullish views on RCom  spent some time on the charts.  Two charts are posted below.  Rcom is still in the bearish mode.  A 5 wave  impulsive down has completed and a correction to that move is going on.

Presently Rcom is in  B c iii  there is still room for more down side,  before the upmove  in wave C begins.  There is still an outside chance that it may not be a B down but  W 2  but I believe otherwise simply because that it has moved too close to the lows of so called W1   yet technically possible that W3 starts from there as Pankaj thinks.  Well  wave B can go below the lows of A as in  irregular corrections.
W 3  or W  C  both offers an opportunity to  mint great money,  so keep an eye.  I will take a ride once I see some sign of reversal,  although I might buy a little expensive.

Happy Trading !

SHEKHAR


Sunday, July 24, 2011

SHREE RENUKA SUGARS

Renuka Sugar is displaying a Dragon formation.  And it has given a BO above its Head.  Target can be 78 and 92. 

Happy Trading !
SHEKHAR


Saturday, October 23, 2010

BREAK OUT STOCK: ESSAROIL

Essar Oil has given a break out from cup & holder formation on daily charts. Possible TGT is 173. one can buy here with SL below 142.

Also on weekly charts it has given a decent break out with good volumes one can hold the position with a deeper SL below 136 for possible higher targets.

Nifty is quite volatile these days, one should avoid short positions in nifty for the time being.

Happy Trading !
RainMaker

Saturday, September 25, 2010

BREAKOUT STOCK: MARUTI

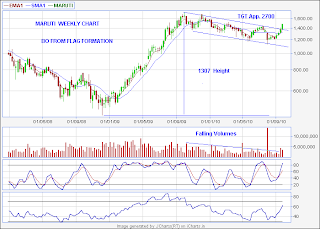
MARUTI has given a BO on weekly charts after being in  consolidation phase for about a year.  Formation on the charts looks like a breakout from Flag.  Approx height of the flag is 1300 and long term investor / trader can buy here with price TGT of 2700 approx. keeping SL of 1126 on  closing basis. 

There was also an opportunity for short term traders as per daily charts when it broke out of 1400 range,  it is  likely to see a sharp run up from here, one should buy if it comes into trading range somewhere closer to 1400 with SL of 1380.  TGT : 1580>1715>all the way to 2700

Nifty and Bank Nifty has given a nice run up after the breakout.  Nifty is now all set for new highs.  Off-course we may see minor correction in coming days, but the trend is up for sure.

Happy Trading !

Monday, August 23, 2010

BREAKOUT STOCK

Mercator Lines (MLL) is on the verge of breakout. Keep a close eye once it closes above 55.00 take a long position.

It can TGT 56.75 > 60.40>62.75>72.10 
Short Term SL 52.20
Mid Term SL 49.60

As I write this it is trading at 54.55 with 1.1 million shares already traded.  Suggestive of positive closing at the end of the day.


Happy Trading !

Tuesday, August 3, 2010

Saturday, July 31, 2010

BREAKOUT IN M&M


Breakout in M&M.

One can buy now with SL of 636 EOD basis.

Short term TGTs can be 690 > 735.

It is now at all time highs can go higher if NIFTY supports.

Wednesday, May 12, 2010

BAJAJHIND IN WOLFE WAVE


Yesterday, Bajajhind hit the SL . But see the hourly charts it has formed a WW here, if it moves as per this we can still meet the targets as posted earlier.

Here is the call as per WW formation.

CALL: BUY
STOP LOSS : 104.80
TGT: 120-125

Tuesday, May 11, 2010

BAJAJHIND READY FOR A BOUNCE


After a consistent fall bajajhind is now ready for a small bounce. One can take a long position here with short term view.

CALL : BUY
STOP LOSS : 110
TGT: 122.6, 130.30, 142.90

Friday, April 30, 2010

ABB


ABB has broken a major support. One can start shorting it add on the pullbacks

SYMBOL: ABB
CALL: SHORT
STOP LOSS: 830
TARGET-1 : 758
TARGET-2 : 680

Thursday, April 29, 2010

EDUCOMP


Educomp has broken a major support. It can see a sharp correction from here onwards. One should add shorts on every rise till 710-715.

SYMBOL : EDUCOMP
CALL : SHORT
STOP LOSS : 720
TARGET 1 : 653
TARGET 2 : 625

Tuesday, April 27, 2010

STERLITE INDUSTRIES


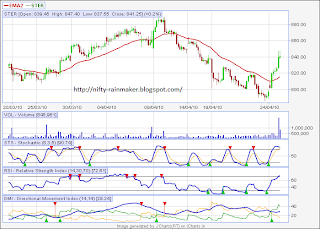
Sterlite Industies is a short term pick.
One can Buy half qty here and rest on declines to 820-830 region.

SYMBOL: STER
CALL : BUY
TARGET: 880
STOP LOSS: 815